The Analytics Dashboard is created to give you an overview of all the assessments created at a glance. Using the insight from the Analytics Dashboard, you can help your clients achieve a better life balance.
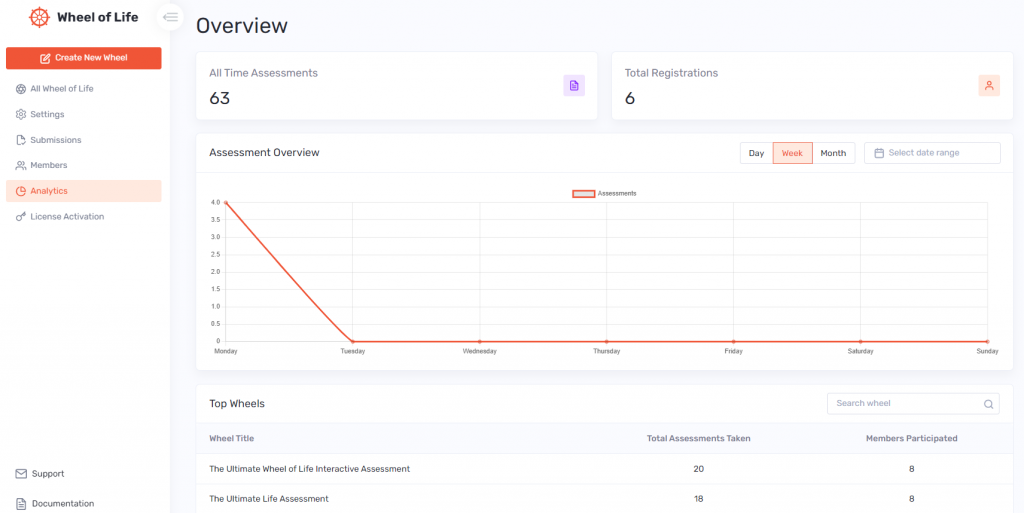
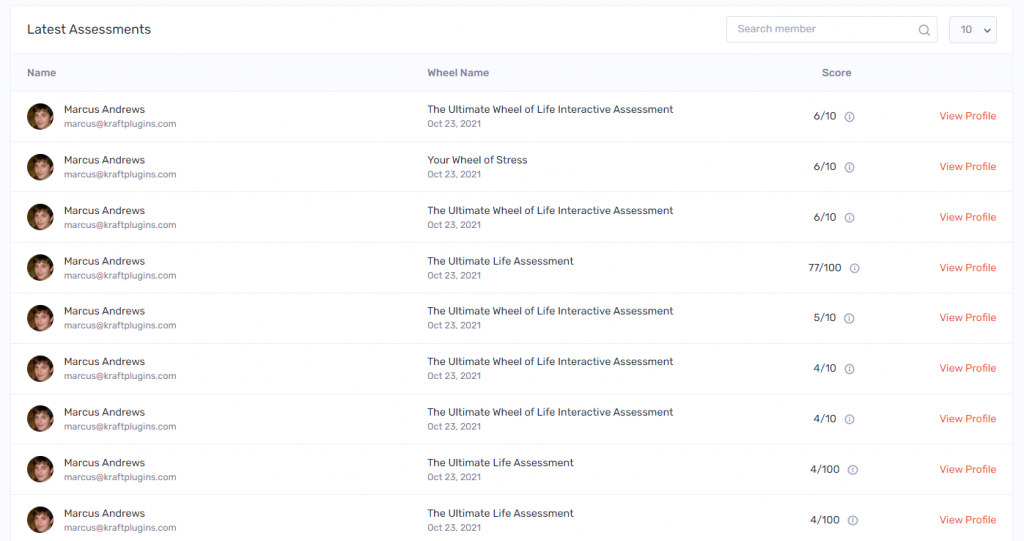
The Analytics Dashboard gives you a total count of the assessments taken and member registrations, assessment overview over a time period, details of top wheels, and the latest assessments.

You can access the Analytics Dashboard via Dashboard > Wheel of Life > Analytics.
Analytics Dashboard is divided into five sections – All Time Assessments, Total Registrations, Assessment Overview, Top Wheels, and Latest Assessments. Here is a description of all the five provided sections:
All Time Assessments: It is the total count of the assessments taken on your website.
Total Registrations: It is the total number of people who have registered for the assessment on your website.
Assessment Overview: It provides a graphical preview of the assessments that have been taken over a specific period of time.

Top Wheels: It provides a listing of the Wheels based on the maximum number of assessments taken and member participation.

Latest Assessments: This section sorts the details of the most recent assessment taken

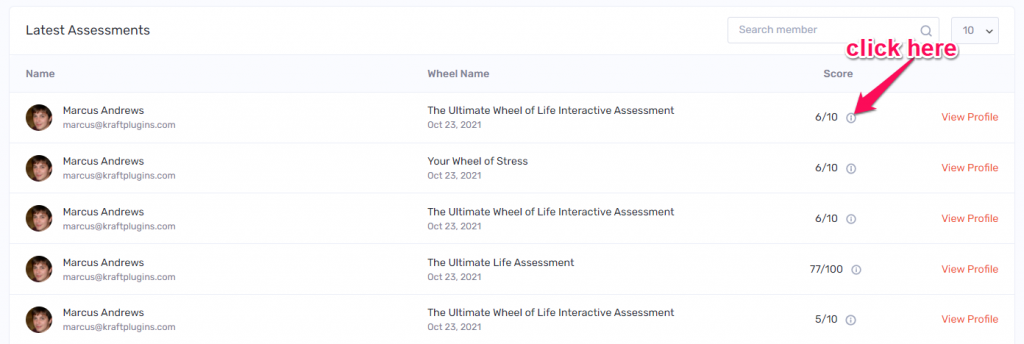
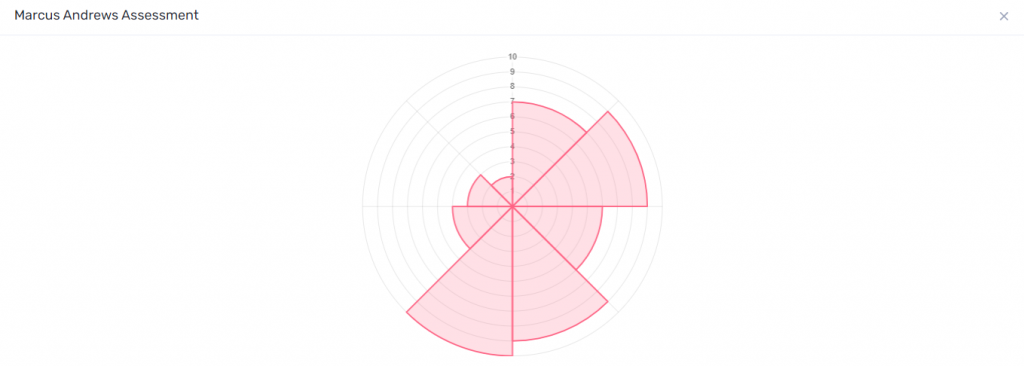
Here, you can click on the icon on the Score row to see the assessment detail.

